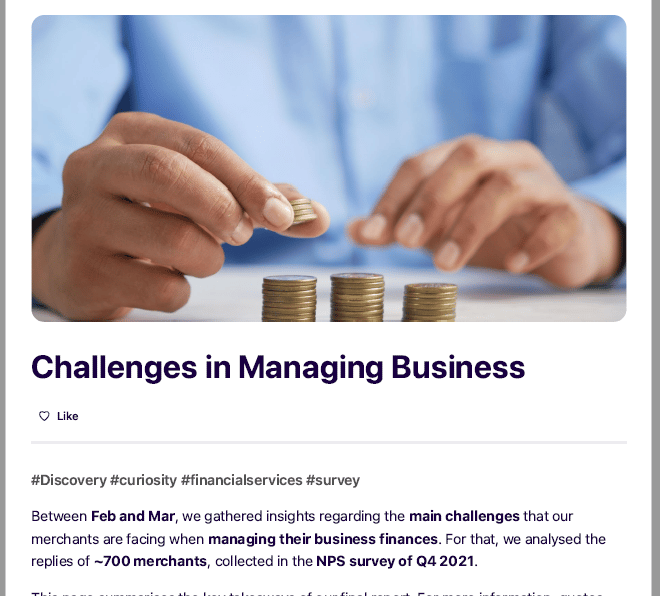
Challenges in Managing Business Finances
NPS Survey Analysis • Explorative UX Research


Overview
Thanks to the marketing team, every quarter, Mollie releases an NPS survey to evaluate customers' sentiments towards the company and its products. These surveys are often an opportunity to interact with a larger portion of our target audience and explore unknown questions.
Around Q1 2022, Mollie took this opportunity to ask customers what challenges they faced when managing their finances. This was also the period when I joined Mollie and was asked to help with the analysis of this project.
Due to NDA purposes, I will not be able to disclosure any of the actual results from this research. As such, while other projects in this portfolio will focus on the general processes that I used, given my late involvement in this one, I will use this page instead to summarise the strategy we adopted to gather insights from the answers, and the eventual impacts that the results had moving forward.
Team
• 1 Marketing Researcher
• 1 Senior User Researcher (yours truly)
My Contributions
• Analysis of the results
• Share/Report the results
Timeline
• Q1 2022

The Process
Typically for any research project, I follow a 6-stage process: Kickoff, Planning, Preparing, Running, Analysing, and Sharing. As mentioned above, I joined Mollie when this project was entering the Analysing phase. The next sections, provide a general summary of each remaining stage.
Analysing the Results ...
How did we get the results?
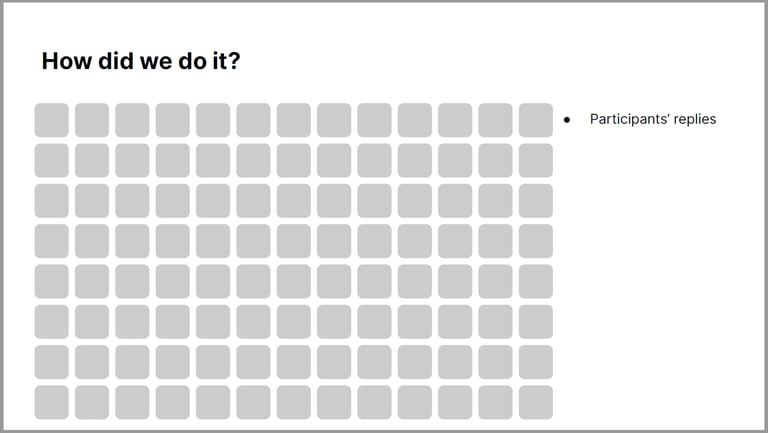
We got the results from a follow-up question to our NPS survey. This was an open-ended question encouraging customers to share with us the main challenge(s) they face when looking at managing their business finances (and beyond the services provided by Mollie).
An approximated total of 700 customers, distributed across a wide range of business types (and other internal categories) replied to this question.
What did we do?
Our process towards analysing these responses can be summarised in the following steps:
• Translate all data to English;
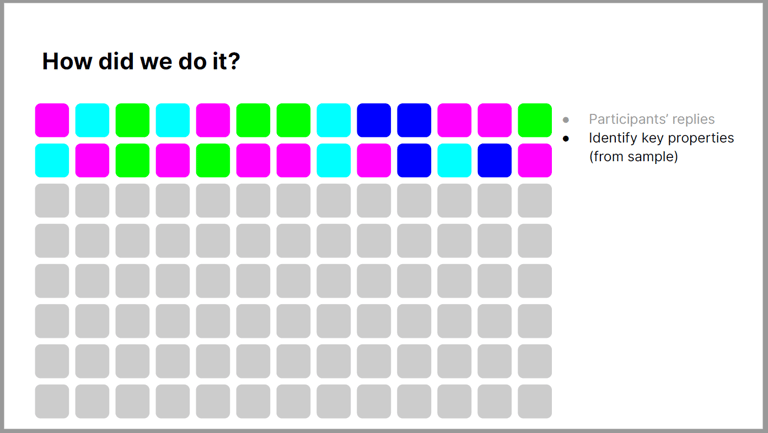
• From a sample of the data (~10-15%), create a collection of tags/categories to summarise the challenge(s) listed by the responses, and define the criteria in which said tags are to be used;
• Review the tags with domain-experts;
• Classify every response with 1-2 key categories;
• Review, identify, and iterate potential inconsistencies with the classification.
Once all data was "normalised" into a set of categories, we proceeded to:
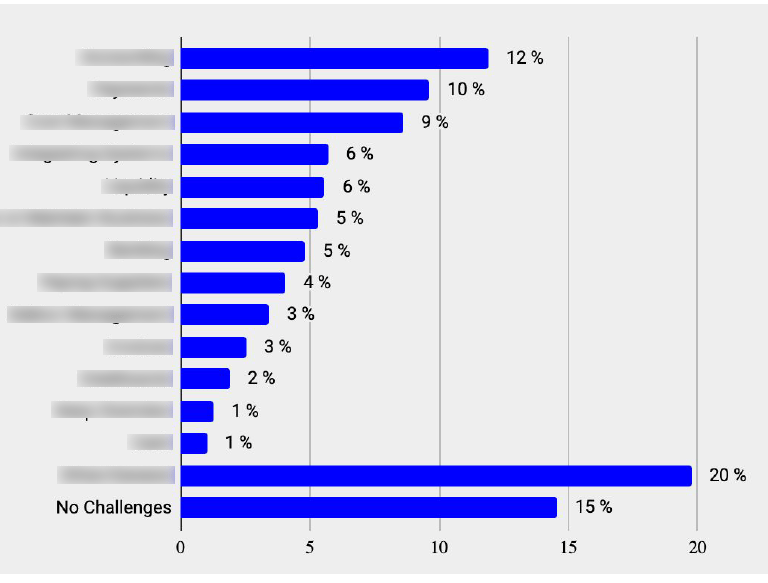
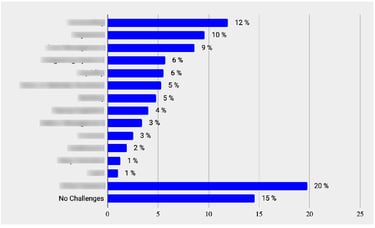
• Identify the most common categories - i.e., the most common issues reported;
• For the most common categories, identify the most common patterns - to assess if and/or what, previously undetected, sub-categories might exist;
• Compare the most common categories to variables of interest - e.g. Is issue X more common for smaller or larger organisations? Are these differences statistically significant? What issues affect the organisations with an ideal customer profile?
• Isolate representative quotes from each category (and potential sub-category) to present to stakeholders.
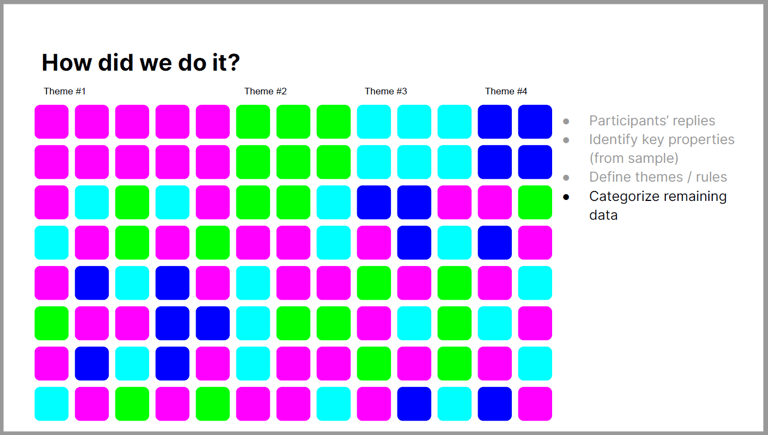
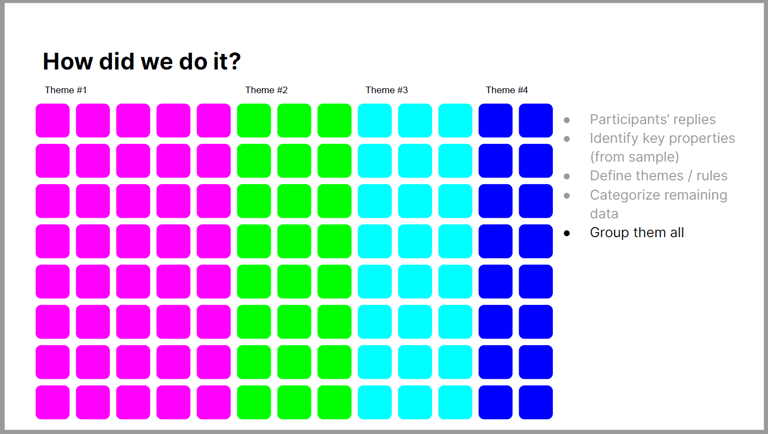
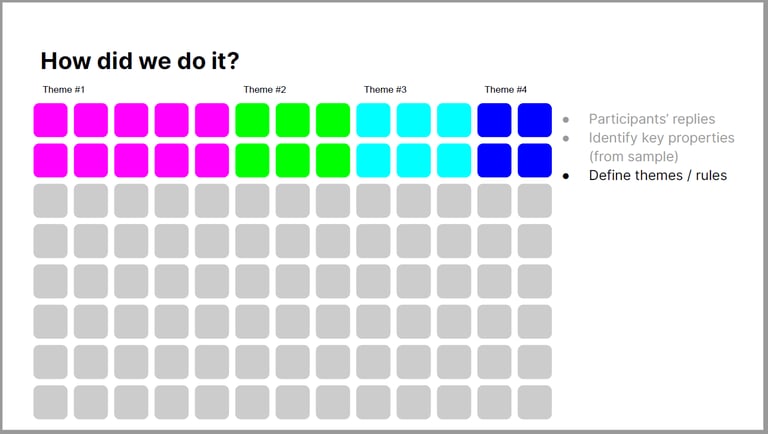
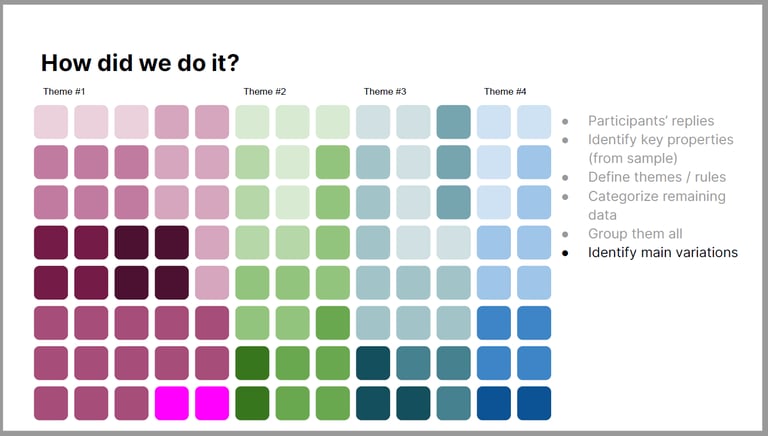
See above for a quick visual representation of this process (from one of the stakeholder presentations held to share the results).
Sharing
As implied by the previous section, some stakeholders were already informed of the progress of our results, as they helped in identifying some of the key categories that we ended up using for our analysis.
In any case, results were shared within the organisation via the following ways:
• Stakeholder presentations - summarising the key insights from our analysis and their business impact;
• Report(s) in our research repository (Dovetail) - to support "offline" access to key insights;
• Full list of categorized raw responses - so that interested stakeholders can view the results in full detail.
Outcomes
Although I was not involved at the beginning of this project, I still considered it relevant to share, due to its impacts on my follow-up work (some of which also published in this portfolio), and to exemplify an instance in which I was still able to significantly contribute, despite a limited involvement.
Overall, through this research, we were able to inform stakeholders about common customer pains, not always caused by or associated with our current products. On one hand, this can be seen as an exercise in empathy; however, it also revealed new opportunities for stakeholders. Ultimately, the identification of the most common types of issues served as both a basis for future exploratory research projects, so that we could learn about some of these issues in more detail, and also supported the prioritisation of team efforts to help minimize the impacts of some (other) issues.